
Simpson’s Paradox – are you telling the “right” story with your data?
Sorry to disappoint Homer Simpson’s fan, but this is about “Simpson’s Paradox” (also known as the Lurking Variable), an effect that all of us should keep in mind as we grab company data and present our findings. One’s “viewpoint” can have an impact on drawing a proper conclusion (or not).
1) A simple example: Lisa and Bart are rated on percent of total New Online Customers retained. Lisa claims that she has the best retention rate. Bart also claims that he has the best retention rate. Who is right?
New Online Customer retention percentage dashboard.
| WK1 | Wk2 | On first glance, Bart seems to be outperforming Lisa on Rep retention at each campaign. But is that a correct conclusion? | |
| Lisa | 0% | 75% | |
| Bart | 25% | 100% |
New Online Customer retention rate with “equal” sample size shown on the right.
| WK1 | WK2 |
VS |
WK1 | WK2 | Total | YTD Pct | |
| Lisa | 0% | 75% | 0/10 | 30/40 | 30/50 | 60% | |
| Bart | 25% | 100% | 10/40 | 10/10 | 20/50 | 40% |
When the “viewpoint” was expanded to include total numbers (equal sample size), the true picture emerges. Lisa outperformed Bart.
2) A real example: In the 1970’s UC Berkeley was sued for sex discrimination because the graduate school accepted only 35% of women while 44% of men were accepted.
Acceptance rate:
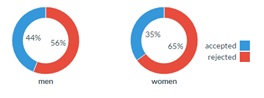
BUT the investigators found that women were slightly “more favored”. How can that be?
| Department | Men | Women | ||
| Applied | Admitted | Applied | Admitted | |
| A | 825 | 62% | 108 | 82% |
| B | 560 | 63% | 25 | 68% |
| C | 325 | 37% | 593 | 34% |
| D | 417 | 33% | 375 | 35% |
| E | 191 | 28% | 393 | 24% |
| F | 373 | 6% | 341 | 7% |
The data from six largest departments
The investigators concluded (by breaking out the data by departments) that women were slightly more favored and that the women “tended to apply to competitive departments with low rates of admission” whereas “men tended to apply to less-competitive departments with high rates of admission”.
Conclusion
We need to ensure that we look at the data using multiple “viewpoints” to ensure that we do not fall into this trap.
Sources:
1 https://en.wikipedia.org/wiki/Simpson%27s_paradox
